This is another BC Admin API with Power Automate guide. Actually the first one I did but didn't blog about it. Here are all the steps!
We also need to make one more change to the D365 BC configuration, in the BC Admin Center visit the Microsoft Entra App section, click to Authorise an new Entra App and paste the App Reg Client ID value.
This will give you a few different visuals that you can adapt. These reports are linked to the SharePoint list.
This report I can publish to my Power BI portal workspace and from there surface in BC or SharePoint etc.
Requirement
I would like to see the capacity of my D365 BC Environments as a chart over time that I can display on my intranet site.
Solution Elements
- Dynamics 365 Business Central API - Business Central Administration Center API - Business Central | Microsoft Learn
- Entra ID App registration for API OAuth authentication - Dynamics 365 Business Central - OAuth 2.0 APIs with Insomnia
- Power Automate Flow - Microsoft Power Automate
- SharePoint List - Introduction to lists - Microsoft Support
- Power BI - Power BI
How to
Get things ready
The D365 BC Admin API we will use for this, is this one Get used storage for all environments.
The end point is quite simple, nothing dynamic:
https://api.businesscentral.dynamics.com
/admin/v2.21/environments/usedstorage
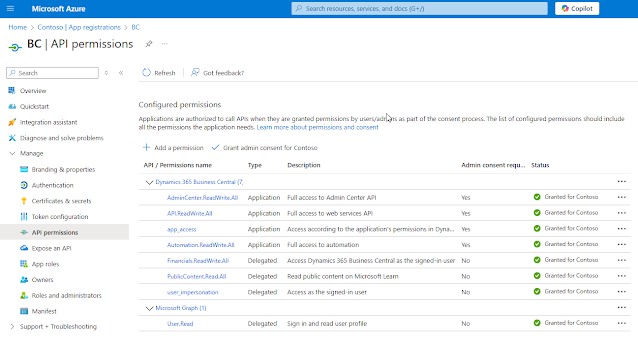
To access this API we need to have an Entra ID App Registration available to us, that has the AdminCenter.ReadWrite.All permission granted.
We will use this App Registration to get an OAuth token and then use that to call the GET /usedstorage API.
The parts you need from the app registration are:
- OAuth 2.0 token endpoint
- App Registration Client ID
- Client Secret Value
 |
| If you didn't make a note of the Secret Value when you created it. Just create another secret and note down the Value. |
We also need to make one more change to the D365 BC configuration, in the BC Admin Center visit the Microsoft Entra App section, click to Authorise an new Entra App and paste the App Reg Client ID value.
Create a new list
- Name of the Environment [text]
- Usage size [decimal]
SharePoint will save the date the row was created so we don't need a separate column for that
I used the 'Title' column to hold the Environment Name and added 1 extra column for the usage size data
Power Automate
Lets create the flow, here is the outline:
How often will your flow run?
Try
This is a scope that will work together with the Catch scope for error handling. There are no settings for this scope.
HTTP (Gimme Token)
- URI = <OAuth 2.0 Token endpoint from your App registration>
- Method = POST
- Headers
- Content-Type = application/x-www-form-urlencoded
- Body
- grant_type=client_credentials
- &client_id=<your app registration ID>
- &client_secret=<your API secret value>
- &scope=https://api.businesscentral.dynamics.com/.default
Parse JSON (Token)
Use the parse action to make the token that gets sent back available for use later in the flow as a separate selectable output from this step
{
"type": "object",
"properties": {
"token_type": {
"type": "string"
},
"expires_in": {
"type": "integer"
},
"ext_expires_in": {
"type": "integer"
},
"access_token": {
"type": "string"
}
}
}
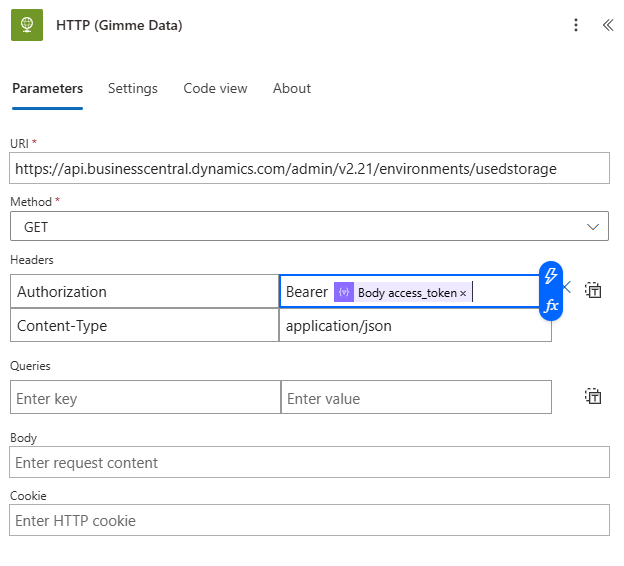
HTTP (Gimme Data)
Send the main request that will GET the used storage for all your environment.
- Headers
- Authorisation = <the token from the previous step - click the lightning and pick from the list>
- Content-Type = applicaion/json
Paste JSON (Data)
Parse the data so we can extract the rows & columns of data returned
{
"type": "object",
"properties": {
"value": {
"type": "array",
"items": {
"type": "object",
"properties": {
"databaseStorageInKilobytes": {
"type": "integer"
},
"applicationFamily": {
"type": "string"
},
"environmentType": {
"type": "string"
},
"environmentName": {
"type": "string"
}
},
"required": [
"databaseStorageInKilobytes",
"applicationFamily",
"environmentType",
"environmentName"
]
}
}
}
}
For Each
The for each loop will then apply the action of 'Create Item' i.e. add a row to the SharePoint list we define
In this action we define which list to use and which values go into which field.
Create a Power BI report
The fastest way to get something cool is use the Integrate > Power BI > Visualise Acton in SharePoint:
This will give you a few different visuals that you can adapt. These reports are linked to the SharePoint list.
You can also pull the data into a desktop Power BI and create that way.
Here is what I created in the end.
This report I can publish to my Power BI portal workspace and from there surface in BC or SharePoint etc.
What do you think?
Please let me know your thoughts in the comments
Connect or follow me on LinkedIn to get all my updates Andrew Wingate | LinkedIn
Click to Follow


